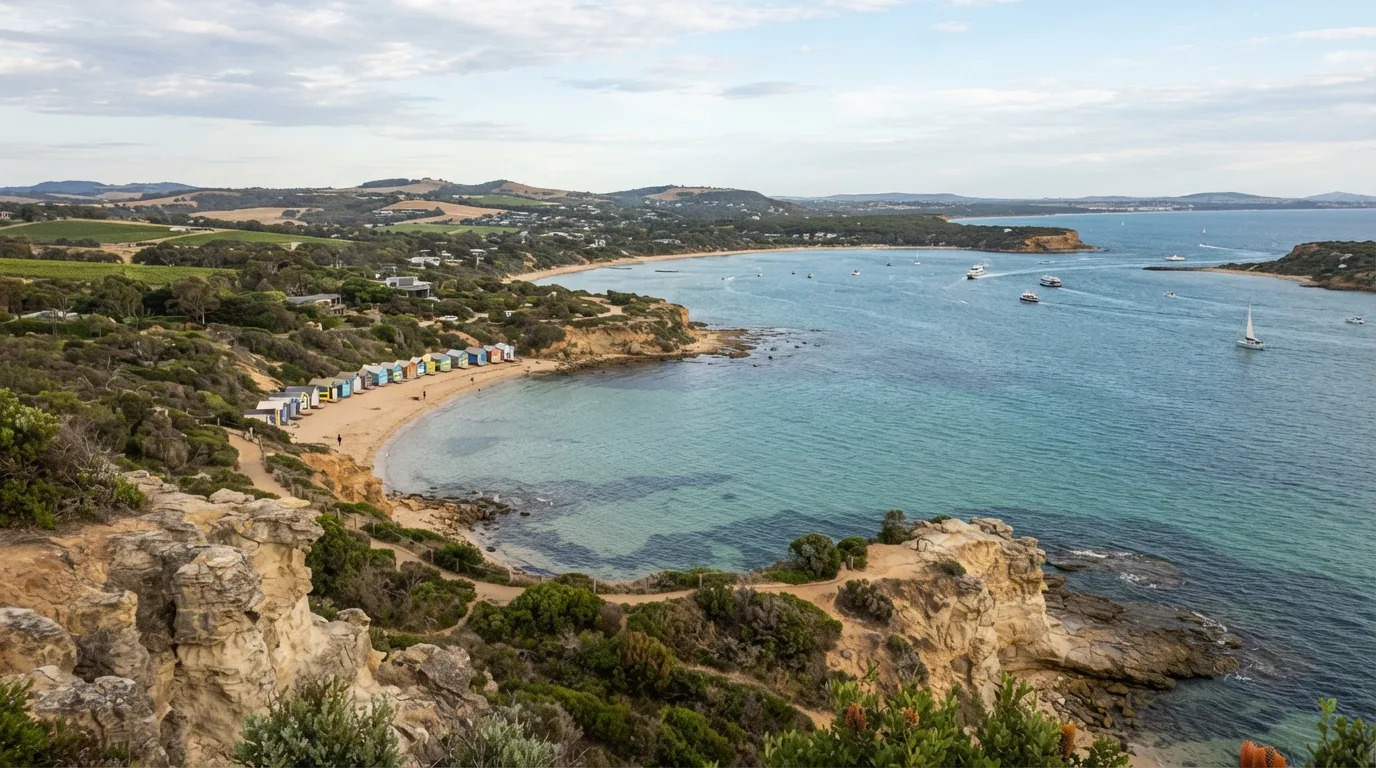
January in Mornington Peninsula — reliably good (2nd best month)
Good · 7.2/10January averages 19°C (66°F) — warm enough for beach and boat plans, still short of the heat that pushes sightseeing into early morning.
Rainfall runs 73 mm, so plan one flexible day in three; you still get about 31 days with 6+ hours of sunshine and 14.4 hours of daylight.
It scores 7.2/10 here, 2nd of 12 months, against 7.9/10 in the destination's best month.
Figure on peak pricing, with this is one of the busiest months here. You are paying the year's highest rates for the year's best conditions — book early or shift a few weeks either side.
Pack light clothing, swimwear and real sun protection, a packable rain layer.
February: the best month of the year in Mornington Peninsula
Best window · 7.9/10February averages 19°C (65°F), the range most people find easiest for walking a city all day without either overheating or losing daylight to weather.
Expect 25 mm of rain — occasional showers rather than washed-out days — alongside about 28 days with 6+ hours of sunshine and 13.5 daylight hours.
On our climate-comfort scale this is the top-ranked month of the year for Mornington Peninsula at 7.9/10 — the reference point every other month on this page is measured against.
Figure on peak pricing, with this is one of the busiest months here. You are paying the year's highest rates for the year's best conditions — book early or shift a few weeks either side.
Pack layers you can shed by midday plus one warm layer for the evening.
March in Mornington Peninsula: strong conditions, 3rd of 12
Good · 7/10Temperatures hover around 18°C (65°F) — the kind of month where neither heat nor cold forces the schedule.
Budget for roughly 50 mm of rain this month — a flexible day or two helps — with about 20 days with 6+ hours of sunshine and 12.3 hours of daylight to work around it.
That is 7/10 on the same scale — 3rd of 12 months, versus 7.9/10 for the best month here.
Expect mid-season pricing, and crowds are moderate.
Pack layers you can shed by midday plus one warm layer for the evening, a packable rain layer.
April in Mornington Peninsula — the hardest end of the year
Hardest · 3.5/10April averages 16°C (61°F), the range most people find easiest for walking a city all day without either overheating or losing daylight to weather.
Rainfall runs 83 mm, so plan one flexible day in three; you still get about 6 days with 6+ hours of sunshine and 11 hours of daylight.
It scores 3.5/10 here, 8th of 12 months, against 7.9/10 in the destination's best month.
Plan for low-season pricing, with crowds are light for this destination.
Pack layers you can shed by midday plus one warm layer for the evening, a packable rain layer.
Flexible dates? February scores 4.4 points higher here — enough to change the trip.
May in Mornington Peninsula — off-season conditions
Hardest · 2.9/10Temperatures hover around 14°C (58°F) — the kind of month where neither heat nor cold forces the schedule.
Budget for roughly 46 mm of rain this month — a flexible day or two helps — with about 1 days with 6+ hours of sunshine and 9.9 hours of daylight to work around it.
That is 2.9/10 on the same scale — 10th of 12 months, versus 7.9/10 for the best month here.
Budget for low-season pricing, and crowds are light for this destination.
Pack layers you can shed by midday plus one warm layer for the evening, a packable rain layer.
If your dates are flexible, February is materially better in Mornington Peninsula — 5 points higher on the same scale.
June in Mornington Peninsula — off-season conditions
Hardest · 2.4/10June averages 13°C (55°F), the range most people find easiest for walking a city all day without either overheating or losing daylight to weather.
Rainfall runs 63 mm, so plan one flexible day in three; you still get almost no days with 6+ hours of sunshine and 9.3 hours of daylight.
It scores 2.4/10 here, 12th of 12 months, against 7.9/10 in the destination's best month.
Plan for low-season pricing, with crowds are light for this destination.
Pack layers you can shed by midday plus one warm layer for the evening, a packable rain layer.
Flexible dates? February scores 5.5 points higher here — enough to change the trip.
July in Mornington Peninsula — the hardest end of the year
Hardest · 2.5/10July averages 12°C (53°F) — jacket weather. Comfortable for walking and museums, too cool for anything water-based.
Rainfall runs 59 mm, so plan one flexible day in three; you still get almost no days with 6+ hours of sunshine and 9.6 hours of daylight.
It scores 2.5/10 here, 11th of 12 months, against 7.9/10 in the destination's best month.
Figure on low-season pricing, with crowds are light for this destination.
Pack a mid-weight jacket, long sleeves and shoes you can walk 15 km in, a packable rain layer.
Flexible dates? February scores 5.4 points higher here — enough to change the trip.
August in Mornington Peninsula: expect compromises
Hardest · 3.1/10Temperatures hover around 12°C (54°F) — the kind of month where neither heat nor cold forces the schedule.
Budget for roughly 60 mm of rain this month — a flexible day or two helps — with about 4 days with 6+ hours of sunshine and 10.5 hours of daylight to work around it.
That is 3.1/10 on the same scale — 9th of 12 months, versus 7.9/10 for the best month here.
Budget for low-season pricing, and crowds are moderate.
Pack layers you can shed by midday plus one warm layer for the evening, a packable rain layer.
If your dates are flexible, February is materially better in Mornington Peninsula — 4.8 points higher on the same scale.
September in Mornington Peninsula — off-season conditions
Hardest · 4.5/10Temperatures hover around 13°C (55°F) — the kind of month where neither heat nor cold forces the schedule.
Budget for roughly 53 mm of rain this month — a flexible day or two helps — with about 13 days with 6+ hours of sunshine and 11.8 hours of daylight to work around it.
That is 4.5/10 on the same scale — 6th of 12 months, versus 7.9/10 for the best month here.
Expect low-season pricing, and crowds are light for this destination. That combination — decent conditions at the lowest rates of the year — is the best value window on this page.
Pack layers you can shed by midday plus one warm layer for the evening, a packable rain layer.
If your dates are flexible, February is materially better in Mornington Peninsula — 3.4 points higher on the same scale.
October in Mornington Peninsula: expect compromises
Hardest · 4.5/10October averages 14°C (57°F), the range most people find easiest for walking a city all day without either overheating or losing daylight to weather.
Monthly rainfall reaches 134 mm — wet for this destination — but about 22 days with 6+ hours of sunshine still break through, so keep one indoor fallback in the plan.
It scores 4.5/10 here, 7th of 12 months, against 7.9/10 in the destination's best month.
Plan for low-season pricing, with crowds are light for this destination.
Pack layers you can shed by midday plus one warm layer for the evening, a proper rain shell rather than an umbrella.
Flexible dates? February scores 3.4 points higher here — enough to change the trip.
November in Mornington Peninsula: mixed conditions, plan around the weather
Trade-offs · 5.4/10November averages 16°C (60°F), the range most people find easiest for walking a city all day without either overheating or losing daylight to weather.
Rainfall runs 89 mm, so plan one flexible day in three; you still get about 27 days with 6+ hours of sunshine and 14.1 hours of daylight.
It scores 5.4/10 here, 5th of 12 months, against 7.9/10 in the destination's best month.
Figure on mid-season pricing, with crowds are moderate.
Pack layers you can shed by midday plus one warm layer for the evening, a packable rain layer.
Flexible dates? February scores 2.5 points higher here — enough to change the trip.
December in Mornington Peninsula — middling scores, decent value
Trade-offs · 6.5/10Temperatures hover around 17°C (63°F) — the kind of month where neither heat nor cold forces the schedule.
Budget for roughly 67 mm of rain this month — a flexible day or two helps — with about 31 days with 6+ hours of sunshine and 14.7 hours of daylight to work around it.
That is 6.5/10 on the same scale — 4th of 12 months, versus 7.9/10 for the best month here.
Expect peak pricing, and crowds are moderate.
Pack layers you can shed by midday plus one warm layer for the evening, a packable rain layer.