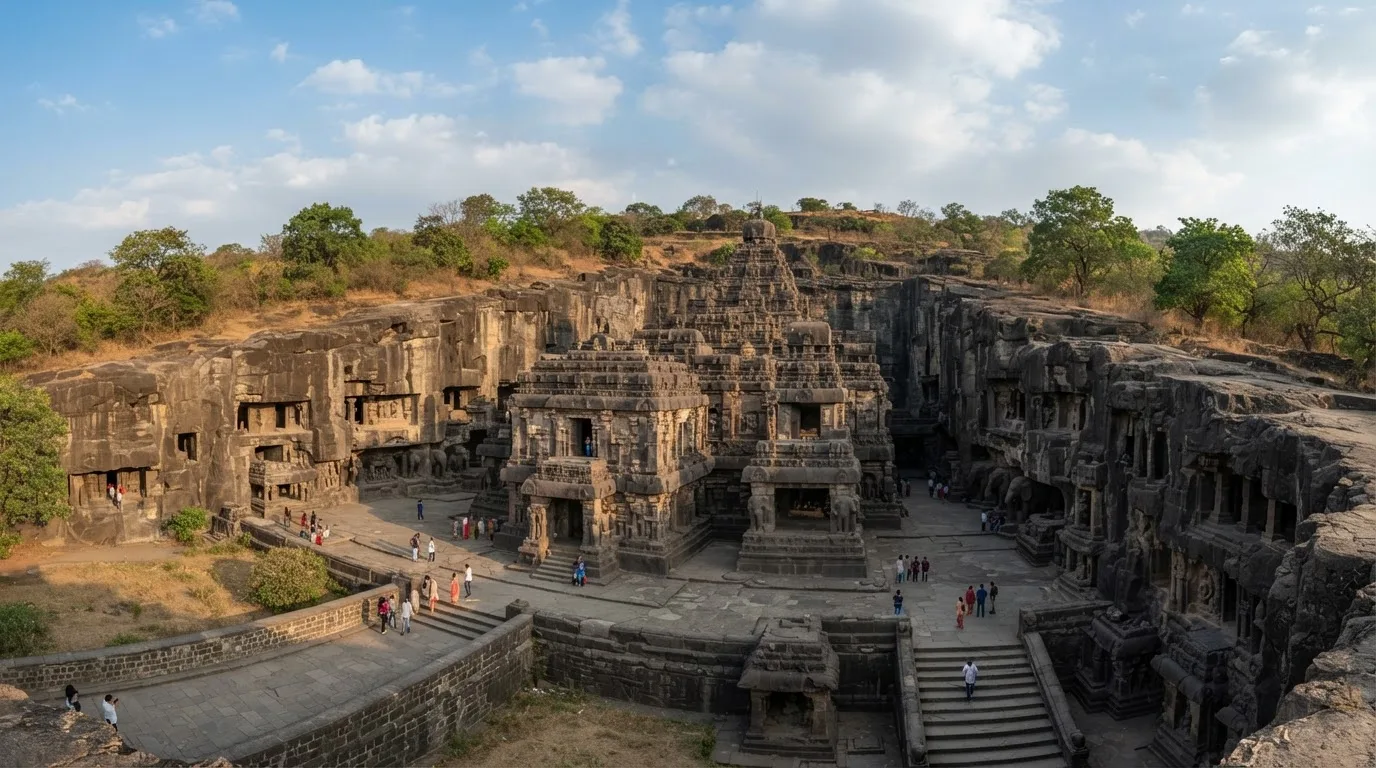
January in Ellora Caves — the year's strongest window
Best window · 9.3/10January averages 20°C (69°F) — warm enough for beach and boat plans, still short of the heat that pushes sightseeing into early morning.
Rain is a non-issue at 5 mm for the month, with about 16 sunny days and 10.9 hours of daylight to work with.
On our climate-comfort scale this is the top-ranked month of the year for Ellora Caves at 9.3/10 — the reference point every other month on this page is measured against.
Expect peak pricing, and this is one of the busiest months here. You are paying the year's highest rates for the year's best conditions — book early or shift a few weeks either side.
Pack light clothing, swimwear and real sun protection.
February in Ellora Caves — the year's strongest window
Best window · 8.5/10February averages 24°C (75°F) — warm enough for beach and boat plans, still short of the heat that pushes sightseeing into early morning.
Rain is a non-issue at 1 mm for the month, with about 23 sunny days and 11.3 hours of daylight to work with.
On our climate-comfort scale this is the top-ranked month of the year for Ellora Caves at 8.5/10 — the reference point every other month on this page is measured against.
Expect mid-season pricing, and crowds are moderate.
Pack light clothing, swimwear and real sun protection.
March in Ellora Caves — workable with trade-offs
Trade-offs · 6.9/10March averages 28°C (82°F), so the practical pattern is early mornings, a long midday break, and evenings back outside.
Rain is a non-issue at 9 mm for the month, with about 27 sunny days and 11.9 hours of daylight to work with.
It scores 6.9/10 here, 6th of 12 months, against 9.3/10 in the destination's best month.
Expect mid-season pricing, and crowds are moderate.
Pack the lightest breathable clothing you own, a hat, and more water than feels necessary.
If your dates are flexible, January is materially better in Ellora Caves — 2.4 points higher on the same scale.
April in Ellora Caves — workable with trade-offs
Trade-offs · 6/10April averages 32°C (89°F), so the practical pattern is early mornings, a long midday break, and evenings back outside.
Expect 16 mm of rain — occasional showers rather than washed-out days — alongside about 30 sunny days and 12.5 daylight hours.
It scores 6/10 here, 8th of 12 months, against 9.3/10 in the destination's best month.
Expect mid-season pricing, and crowds are moderate.
Pack the lightest breathable clothing you own, a hat, and more water than feels necessary.
If your dates are flexible, January is materially better in Ellora Caves — 3.3 points higher on the same scale.
May in Ellora Caves — workable with trade-offs
Trade-offs · 6.4/10May averages 33°C (91°F) — genuinely punishing heat. Anything outdoors needs to happen before 10am.
Rain is a non-issue at 11 mm for the month, with about 31 sunny days and 12.9 hours of daylight to work with.
It scores 6.4/10 here, 7th of 12 months, against 9.3/10 in the destination's best month.
Expect mid-season pricing, and crowds are light for this destination.
Pack the lightest breathable clothing you own, a hat, and more water than feels necessary.
If your dates are flexible, January is materially better in Ellora Caves — 2.9 points higher on the same scale.
June in Ellora Caves — workable with trade-offs
Trade-offs · 5.1/10June averages 29°C (85°F), so the practical pattern is early mornings, a long midday break, and evenings back outside.
At 106 mm this is a genuinely wet month: about 25 sunny days in total, and outdoor plans need an indoor fallback.
It scores 5.1/10 here, 9th of 12 months, against 9.3/10 in the destination's best month.
Expect low-season pricing, and crowds are light for this destination.
Pack the lightest breathable clothing you own, a hat, and more water than feels necessary, a proper rain shell rather than an umbrella.
If your dates are flexible, January is materially better in Ellora Caves — 4.2 points higher on the same scale.
July in Ellora Caves — the hardest end of the year
Hardest · 4.3/10July averages 26°C (78°F) — warm enough for beach and boat plans, still short of the heat that pushes sightseeing into early morning.
201 mm of rain puts this in monsoon territory — about 11 sunny days across the whole month, and multi-day washouts are normal.
It scores 4.3/10 here, 12th of 12 months, against 9.3/10 in the destination's best month.
Expect low-season pricing, and crowds are light for this destination.
Pack light clothing, swimwear and real sun protection, a proper rain shell rather than an umbrella.
If your dates are flexible, January is materially better in Ellora Caves — 5 points higher on the same scale.
August in Ellora Caves — the hardest end of the year
Hardest · 4.9/10August averages 26°C (78°F) — warm enough for beach and boat plans, still short of the heat that pushes sightseeing into early morning.
At 161 mm this is a genuinely wet month: about 14 sunny days in total, and outdoor plans need an indoor fallback.
It scores 4.9/10 here, 10th of 12 months, against 9.3/10 in the destination's best month.
Expect mid-season pricing, and crowds are moderate.
Pack light clothing, swimwear and real sun protection, a proper rain shell rather than an umbrella.
If your dates are flexible, January is materially better in Ellora Caves — 4.4 points higher on the same scale.
September in Ellora Caves — the hardest end of the year
Hardest · 4.7/10September averages 25°C (77°F) — warm enough for beach and boat plans, still short of the heat that pushes sightseeing into early morning.
At 191 mm this is a genuinely wet month: about 15 sunny days in total, and outdoor plans need an indoor fallback.
It scores 4.7/10 here, 11th of 12 months, against 9.3/10 in the destination's best month.
Expect low-season pricing, and crowds are light for this destination.
Pack light clothing, swimwear and real sun protection, a proper rain shell rather than an umbrella.
If your dates are flexible, January is materially better in Ellora Caves — 4.6 points higher on the same scale.
October in Ellora Caves — reliably good (5th best month)
Good · 7.5/10October averages 24°C (75°F) — warm enough for beach and boat plans, still short of the heat that pushes sightseeing into early morning.
Rainfall runs 72 mm, so plan one flexible day in three; you still get about 21 sunny days and 11.5 hours of daylight.
It scores 7.5/10 here, 5th of 12 months, against 9.3/10 in the destination's best month.
Expect mid-season pricing, and crowds are moderate.
Pack light clothing, swimwear and real sun protection, a packable rain layer.
If your dates are flexible, January is materially better in Ellora Caves — 1.8 points higher on the same scale.
November in Ellora Caves — the year's strongest window
Best window · 9.3/10November averages 21°C (70°F) — warm enough for beach and boat plans, still short of the heat that pushes sightseeing into early morning.
Expect 22 mm of rain — occasional showers rather than washed-out days — alongside about 17 sunny days and 11 daylight hours.
On our climate-comfort scale this is the top-ranked month of the year for Ellora Caves at 9.3/10 — the reference point every other month on this page is measured against.
Expect peak pricing, and this is one of the busiest months here. You are paying the year's highest rates for the year's best conditions — book early or shift a few weeks either side.
Pack light clothing, swimwear and real sun protection.
December in Ellora Caves — the year's strongest window
Best window · 9.2/10December averages 21°C (69°F) — warm enough for beach and boat plans, still short of the heat that pushes sightseeing into early morning.
Rain is a non-issue at 11 mm for the month, with about 14 sunny days and 10.8 hours of daylight to work with.
On our climate-comfort scale this is the top-ranked month of the year for Ellora Caves at 9.2/10 — the reference point every other month on this page is measured against.
Expect peak pricing, and this is one of the busiest months here. You are paying the year's highest rates for the year's best conditions — book early or shift a few weeks either side.
Pack light clothing, swimwear and real sun protection.