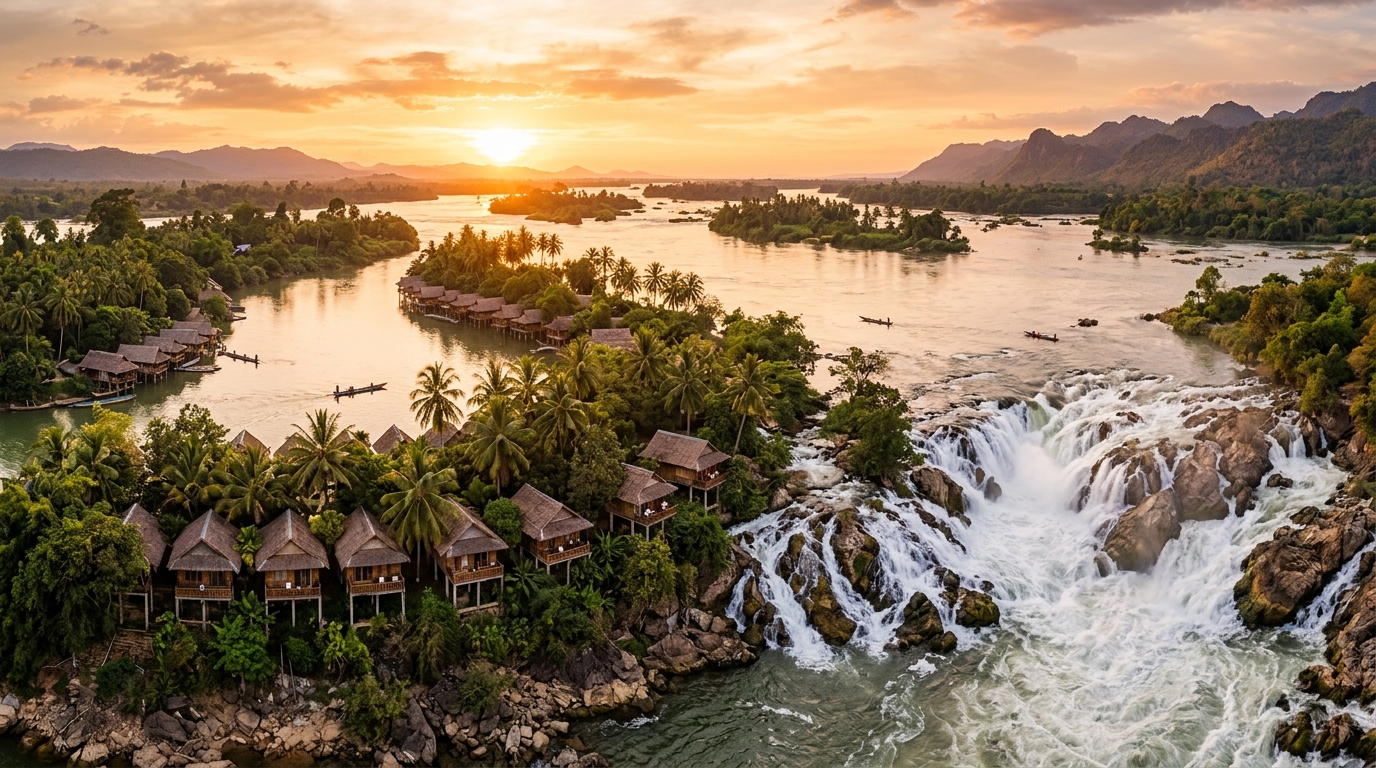
January is one of the strongest months in Vang Vieng (2nd)
Best window · 8.7/10Trail conditions at 19°C (66°F) favour early starts and shaded routes in January; midday is for water breaks, not for exposed climbs.
At just 12 mm for the month, rain will not shape your plans; you get about 17 days with 6+ hours of sunshine and 11 hours of daylight.
On our climate-comfort scale this is one of the strongest months of the year for Vang Vieng at 8.7/10 (2nd of 12), just behind February at 9.1/10.
Budget for peak pricing, and this is one of the busiest months here. You are paying the year's highest rates for the year's best conditions — book early or shift a few weeks either side.
Pack light clothing, a hat and real sun protection, footwear you can get muddy.
February in Vang Vieng tops the year's climate scores
Best window · 9.1/10Trail conditions at 22°C (71°F) favour early starts and shaded routes in February; midday is for water breaks, not for exposed climbs.
With around 31 mm of rain, any showers tend to pass through rather than settle in; about 18 days with 6+ hours of sunshine and 11.4 hours of daylight fill the rest.
On our climate-comfort scale this is the top-ranked month of the year for Vang Vieng at 9.1/10 — the reference point every other month on this page is measured against.
Expect peak pricing, and this is one of the busiest months here. You are paying the year's highest rates for the year's best conditions — book early or shift a few weeks either side.
Pack light clothing, a hat and real sun protection, footwear you can get muddy.
March in Vang Vieng — reliably good (5th best month)
Good · 7.9/10March averages 24°C (76°F) — warm for the outdoors: start trails early, use shaded routes at midday, and carry more water than you think you need.
Rainfall runs 69 mm, so plan one flexible day in three; you still get about 23 days with 6+ hours of sunshine and 11.9 hours of daylight.
It scores 7.9/10 here, 5th of 12 months, against 9.1/10 in the destination's best month.
Plan for mid-season pricing, with crowds are moderate.
Pack light clothing, a hat and real sun protection, a packable rain layer, footwear you can get muddy.
April in Vang Vieng: mixed conditions, plan around the weather
Trade-offs · 6.8/10Days in April average 27°C (81°F) — front-load outdoor plans before the heat builds and treat the middle of the day as indoor time.
Budget for roughly 62 mm of rain this month — a flexible day or two helps — with about 24 days with 6+ hours of sunshine and 12.4 hours of daylight to work around it.
That is 6.8/10 on the same scale — 7th of 12 months, versus 9.1/10 for the best month here.
Expect mid-season pricing, and crowds are moderate.
Pack the lightest breathable clothing you own, a hat, and more water than feels necessary, a packable rain layer, footwear you can get muddy.
If your dates are flexible, February is materially better in Vang Vieng — 2.3 points higher on the same scale.
May in Vang Vieng: mixed conditions, plan around the weather
Trade-offs · 5.7/10May averages 26°C (79°F) and humidity near 75%, so the practical pattern is early mornings, a long midday break, and evenings back outside.
Monthly rainfall reaches 160 mm — wet for this destination — but about 21 days with 6+ hours of sunshine still break through, so keep one indoor fallback in the plan.
It scores 5.7/10 here, 8th of 12 months, against 9.1/10 in the destination's best month.
Figure on low-season pricing, with crowds are light for this destination.
Pack the lightest breathable clothing you own, a hat, and more water than feels necessary, a proper rain shell rather than an umbrella, footwear you can get muddy.
Flexible dates? February scores 3.4 points higher here — enough to change the trip.
June in Vang Vieng: mixed conditions, plan around the weather
Trade-offs · 5.6/10Trail conditions at 25°C (77°F) favour early starts and shaded routes in June; midday is for water breaks, not for exposed climbs.
171 mm of rain signals a properly wet month, with only about 18 days with 6+ hours of sunshine to count on — build indoor options into the schedule.
That is 5.6/10 on the same scale — 9th of 12 months, versus 9.1/10 for the best month here.
Budget for low-season pricing, and crowds are light for this destination.
Pack light clothing, a hat and real sun protection, a proper rain shell rather than an umbrella, footwear you can get muddy.
If your dates are flexible, February is materially better in Vang Vieng — 3.5 points higher on the same scale.
July in Vang Vieng — middling scores, decent value
Trade-offs · 5.5/10Trail conditions at 25°C (78°F) favour early starts and shaded routes in July; midday is for water breaks, not for exposed climbs.
187 mm of rain signals a properly wet month, with only about 18 days with 6+ hours of sunshine to count on — build indoor options into the schedule.
That is 5.5/10 on the same scale — 10th of 12 months, versus 9.1/10 for the best month here.
Expect low-season pricing, and crowds are moderate.
Pack light clothing, a hat and real sun protection, a proper rain shell rather than an umbrella, footwear you can get muddy.
If your dates are flexible, February is materially better in Vang Vieng — 3.6 points higher on the same scale.
August in Vang Vieng — middling scores, decent value
Trade-offs · 5.2/10August averages 25°C (76°F) — warm for the outdoors: start trails early, use shaded routes at midday, and carry more water than you think you need.
At 199 mm this is a genuinely wet month: about 14 days with 6+ hours of sunshine in total, and outdoor plans need an indoor fallback.
It scores 5.2/10 here, 12th of 12 months, against 9.1/10 in the destination's best month.
Plan for low-season pricing, with crowds are light for this destination.
Pack light clothing, a hat and real sun protection, a proper rain shell rather than an umbrella, footwear you can get muddy.
Flexible dates? February scores 3.9 points higher here — enough to change the trip.
September in Vang Vieng — middling scores, decent value
Trade-offs · 5.4/10September averages 25°C (76°F) — warm for the outdoors: start trails early, use shaded routes at midday, and carry more water than you think you need.
At 161 mm this is a genuinely wet month: about 15 days with 6+ hours of sunshine in total, and outdoor plans need an indoor fallback.
It scores 5.4/10 here, 11th of 12 months, against 9.1/10 in the destination's best month.
Plan for low-season pricing, with crowds are light for this destination.
Pack light clothing, a hat and real sun protection, a proper rain shell rather than an umbrella, footwear you can get muddy.
Flexible dates? February scores 3.7 points higher here — enough to change the trip.
October in Vang Vieng — reliably good (6th best month)
Good · 7.9/10Trail conditions at 24°C (75°F) favour early starts and shaded routes in October; midday is for water breaks, not for exposed climbs.
With around 43 mm of rain, any showers tend to pass through rather than settle in; about 20 days with 6+ hours of sunshine and 11.6 hours of daylight fill the rest.
That is 7.9/10 on the same scale — 6th of 12 months, versus 9.1/10 for the best month here.
Expect mid-season pricing, and crowds are moderate.
Pack light clothing, a hat and real sun protection, footwear you can get muddy.
November is one of the strongest months in Vang Vieng (4th)
Best window · 8.6/10Trail conditions at 23°C (73°F) favour early starts and shaded routes in November; midday is for water breaks, not for exposed climbs.
At just 13 mm for the month, rain will not shape your plans; you get about 19 days with 6+ hours of sunshine and 11.1 hours of daylight.
On our climate-comfort scale this is one of the strongest months of the year for Vang Vieng at 8.6/10 (4th of 12), just behind February at 9.1/10.
Expect peak pricing, and crowds are moderate.
Pack light clothing, a hat and real sun protection, footwear you can get muddy.
December ranks 3rd of 12 for Vang Vieng — one of the best windows
Best window · 8.7/10December averages 20°C (68°F) — warm for the outdoors: start trails early, use shaded routes at midday, and carry more water than you think you need.
Rain is a non-issue at 2 mm for the month, with about 16 days with 6+ hours of sunshine and 10.9 hours of daylight to work with.
A 8.7/10 puts this among the year's best months in Vang Vieng (3rd of 12); only February scores higher, at 9.1/10.
Figure on peak pricing, with this is one of the busiest months here. You are paying the year's highest rates for the year's best conditions — book early or shift a few weeks either side.
Pack light clothing, a hat and real sun protection, footwear you can get muddy.