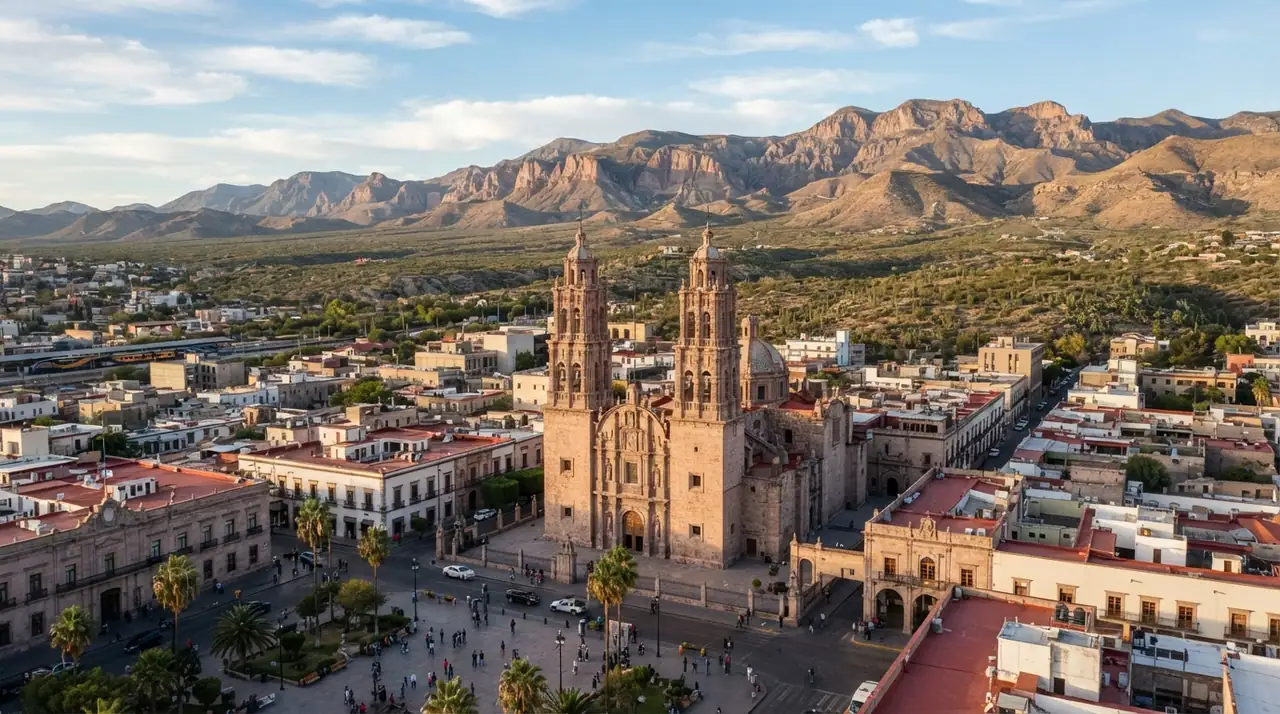
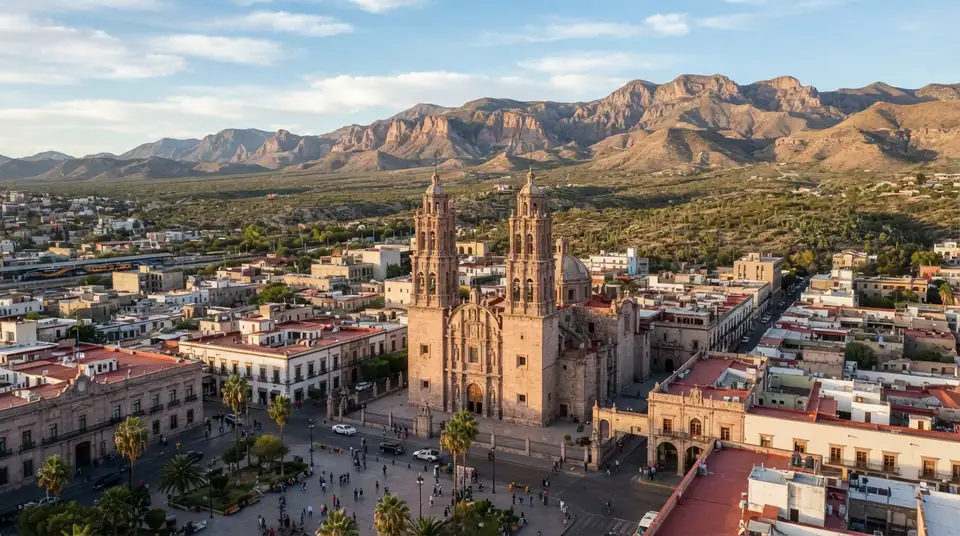
January in Chihuahua — reliably good (9th best month)
Good · 8.2/10January averages 9°C (48°F) — jacket weather. Comfortable for walking and museums, too cool for anything water-based.
Rain is a non-issue at 2 mm for the month, with about 16 sunny days and 10.4 hours of daylight to work with.
It scores 8.2/10 here, 9th of 12 months, against 9.8/10 in the destination's best month.
Expect mid-season pricing, and crowds are moderate.
Pack a mid-weight jacket, long sleeves and shoes you can walk 15 km in.
If your dates are flexible, October is materially better in Chihuahua — 1.6 points higher on the same scale.
February in Chihuahua — the year's strongest window
Best window · 8.6/10February averages 10°C (51°F) — jacket weather. Comfortable for walking and museums, too cool for anything water-based.
Rain is a non-issue at 4 mm for the month, with about 20 sunny days and 11 hours of daylight to work with.
On our climate-comfort scale this is the top-ranked month of the year for Chihuahua at 8.6/10 — the reference point every other month on this page is measured against.
Expect mid-season pricing, and crowds are moderate.
Pack a mid-weight jacket, long sleeves and shoes you can walk 15 km in.
March in Chihuahua — the year's strongest window
Best window · 9.3/10March averages 14°C (57°F), the range most people find easiest for walking a city all day without either overheating or losing daylight to weather.
Rain is a non-issue at 10 mm for the month, with about 31 sunny days and 11.8 hours of daylight to work with.
On our climate-comfort scale this is the top-ranked month of the year for Chihuahua at 9.3/10 — the reference point every other month on this page is measured against.
Expect mid-season pricing, and crowds are moderate.
Pack layers you can shed by midday plus one warm layer for the evening.
April in Chihuahua — the year's strongest window
Best window · 9.4/10April averages 19°C (66°F), the range most people find easiest for walking a city all day without either overheating or losing daylight to weather.
Rain is a non-issue at 0 mm for the month, with about 30 sunny days and 12.7 hours of daylight to work with.
On our climate-comfort scale this is the top-ranked month of the year for Chihuahua at 9.4/10 — the reference point every other month on this page is measured against.
Expect mid-season pricing, and crowds are moderate.
Pack layers you can shed by midday plus one warm layer for the evening.
May in Chihuahua — the year's strongest window
Best window · 8.8/10May averages 23°C (74°F) — warm enough for beach and boat plans, still short of the heat that pushes sightseeing into early morning.
Rain is a non-issue at 12 mm for the month, with about 31 sunny days and 13.4 hours of daylight to work with.
On our climate-comfort scale this is the top-ranked month of the year for Chihuahua at 8.8/10 — the reference point every other month on this page is measured against.
Expect mid-season pricing, and crowds are moderate.
Pack light clothing, swimwear and real sun protection.
June in Chihuahua — reliably good (11th best month)
Good · 7.5/10June averages 27°C (80°F), so the practical pattern is early mornings, a long midday break, and evenings back outside.
Expect 33 mm of rain — occasional showers rather than washed-out days — alongside about 30 sunny days and 13.8 daylight hours.
It scores 7.5/10 here, 11th of 12 months, against 9.8/10 in the destination's best month.
Expect low-season pricing, and crowds are light for this destination.
Pack the lightest breathable clothing you own, a hat, and more water than feels necessary.
If your dates are flexible, October is materially better in Chihuahua — 2.3 points higher on the same scale.
July in Chihuahua — reliably good (10th best month)
Good · 7.7/10July averages 26°C (79°F), so the practical pattern is early mornings, a long midday break, and evenings back outside.
Rainfall runs 48 mm, so plan one flexible day in three; you still get about 31 sunny days and 13.7 hours of daylight.
It scores 7.7/10 here, 10th of 12 months, against 9.8/10 in the destination's best month.
Expect mid-season pricing, and crowds are moderate.
Pack the lightest breathable clothing you own, a hat, and more water than feels necessary, a packable rain layer.
If your dates are flexible, October is materially better in Chihuahua — 2.1 points higher on the same scale.
August in Chihuahua — reliably good (12th best month)
Good · 7.3/10August averages 25°C (76°F) — warm enough for beach and boat plans, still short of the heat that pushes sightseeing into early morning.
At 102 mm this is a genuinely wet month: about 30 sunny days in total, and outdoor plans need an indoor fallback.
It scores 7.3/10 here, 12th of 12 months, against 9.8/10 in the destination's best month.
Expect low-season pricing, and crowds are light for this destination.
Pack light clothing, swimwear and real sun protection, a proper rain shell rather than an umbrella.
If your dates are flexible, October is materially better in Chihuahua — 2.5 points higher on the same scale.
September in Chihuahua — the year's strongest window
Best window · 9.4/10September averages 23°C (73°F) — warm enough for beach and boat plans, still short of the heat that pushes sightseeing into early morning.
Expect 35 mm of rain — occasional showers rather than washed-out days — alongside about 27 sunny days and 12.2 daylight hours.
On our climate-comfort scale this is the top-ranked month of the year for Chihuahua at 9.4/10 — the reference point every other month on this page is measured against.
Expect mid-season pricing, and crowds are moderate.
Pack light clothing, swimwear and real sun protection.
October in Chihuahua — the year's strongest window
Best window · 9.8/10October averages 19°C (65°F), the range most people find easiest for walking a city all day without either overheating or losing daylight to weather.
Expect 20 mm of rain — occasional showers rather than washed-out days — alongside about 23 sunny days and 11.3 daylight hours.
On our climate-comfort scale this is the top-ranked month of the year for Chihuahua at 9.8/10 — the reference point every other month on this page is measured against.
Expect mid-season pricing, and crowds are moderate.
Pack layers you can shed by midday plus one warm layer for the evening.
November in Chihuahua — the year's strongest window
Best window · 8.9/10November averages 13°C (55°F), the range most people find easiest for walking a city all day without either overheating or losing daylight to weather.
Rain is a non-issue at 4 mm for the month, with about 16 sunny days and 10.5 hours of daylight to work with.
On our climate-comfort scale this is the top-ranked month of the year for Chihuahua at 8.9/10 — the reference point every other month on this page is measured against.
Expect mid-season pricing, and crowds are moderate.
Pack layers you can shed by midday plus one warm layer for the evening.
December in Chihuahua — reliably good (8th best month)
Good · 8.3/10December averages 11°C (51°F) — jacket weather. Comfortable for walking and museums, too cool for anything water-based.
Rain is a non-issue at 1 mm for the month, with about 14 sunny days and 10.2 hours of daylight to work with.
It scores 8.3/10 here, 8th of 12 months, against 9.8/10 in the destination's best month.
Expect mid-season pricing, and crowds are moderate.
Pack a mid-weight jacket, long sleeves and shoes you can walk 15 km in.
If your dates are flexible, October is materially better in Chihuahua — 1.5 points higher on the same scale.